


特定吸收比的验证
日期:2012-06-19
Specific Absorption Rate Probes |
|
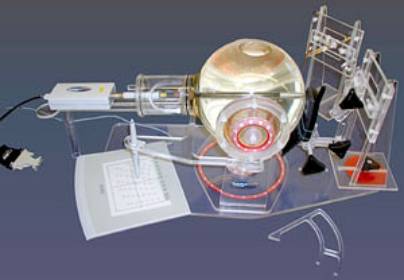
IntroductionIndeXsar are a new company designing and manufacturing positioning systems and E-field probes (SAR (Specific Absorption Rate) probes) for mobile phone testing applications. IndeXsar’s new product, MapSAR, is a benchtop SAR pre-compliance assessment system used for the testing of mobile telecommunications systems, for example mobile telephones.
Figure 1: IndeXsar MapSAR Test Fixture IndeXsar contracted Flomerics to develop a model of the MapSAR test fixture with the objective of investigating and characterising the electric fields generated within the test fixture when energised with a balanced dipole source, to aid with the calibration of the system. The objectives of the program of work were:
Model DescriptionA geometric model of the MapSAR test fixture was set up within FLO/EMC and was energised with a balanced dipole, as used in the calibration of the system, which was excited with a unit power feed. The electric field produced within the test fixture was monitored at the following frequencies:
Simulations PerformedTo characterise the electric field decay within the test fixture and to investigate the effect of the frequency dependent material properties on the electric field decay the following simulations were performed:
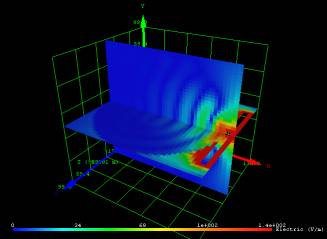
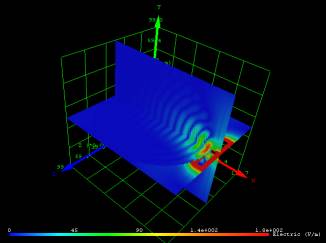
Model Results and DiscussionThe results of the FLO/EMC analysis have been displayed in diagrammatic form showing electric fields as solid fills (contours). Values for the electric fields can be obtained from the colour bar in each diagram. To aid visualisation the colour scales use the same ranges on different diagrams. The scale was set to run from 0.0 V/m to 30 V/m. Figures 2 to 7 show the results for the six simulations performed.
Figure 2: MapSAR 1, 900 MHz Frequency, 900 MHz Tissue Simulant Properties
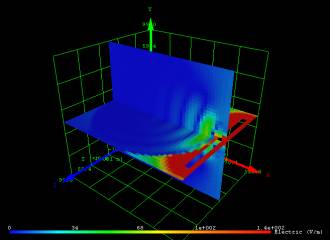
Figure 3: MapSAR 2, 900 MHz Frequency, 1800 MHz Tissue Simulant Properties
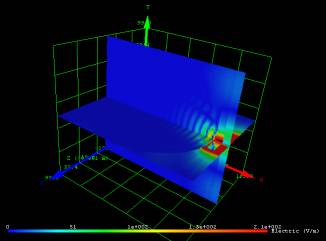
Figure 4: MapSAR 3, 1800 MHz Frequency, 1800 MHz Tissue Simulant Properties
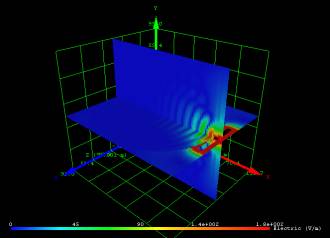
Figure 5: MapSAR 4, 1800 MHz Frequency, 900 MHz Tissue Simulant Properties
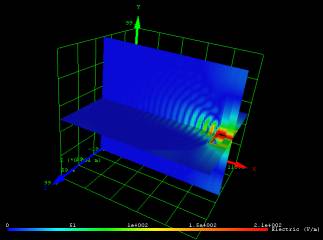
Figure 6: MapSAR 5, 2450 MHz Frequency, 2450 MHz Tissue Simulant Properties
Figure 7: MapSAR 6, 2450 MHz Frequency, 900 MHz Tissue Simulant Properties The results show that there is a greater level of field penetration within the MapSAR test fixture when the 900 MHz head tissue simulant properties were used when compared with the 1800 MHz and 2450 MHz head tissue simulants. Although all three material properties had a similar centre line decay profile within the MapSAR test fixture. The results also show that the field penetration within the MapSAR test fixture increased with increasing frequency, and this occurred with the three head tissue simulant properties investigated at 900 MHz, 1800 MHz and 2450 MHz Model ValidationThe SAR variation across the surface of the sphere was compared with measured results and these are shown in Figures 8 to 10. The SAR value in the following graphs was calculated from the following equation:
Where: SAR – Specific Absorption Rate (W/kg) E – Electric Field (V/m) s – Conductivity (S/m) r – Density (kg/m3)
Figure 8: SAR Variation Across Surface of Sphere at 900 MHz, 900 MHz Tissue Simulant
Figure 9: SAR Variation Across Surface of Sphere at 1800 MHz, 1800 MHz Tissue Simulant
Figure 10: SAR Variation Across Surface of Sphere at 2450 MHz, 4500 MHz Tissue Simulant The results show a good correlation between the measured and modelled results, with the maximum errors at the three frequencies being as follows:
AcknowledgmentsFlomerics would like to thank IndeXsar for their support and allowing the use of the data produced during this project. |


 沪公网安备 31010602003953号