


使用CFD设计和优化数据中心
日期:2012-06-20
作者:Wong Voon Hon 博士
Flomerics S.E. Asia Pte Ltd.
内容概要:数据中心内的电子器件的大部分为微处理器和集成电路,而这些元器件结温超出允许的最大限度将降低设备的可靠性甚至导致设备故障,所以保证结温处于最大限度内至关重要。因此,设备生产商通常指定各自设备的温度范围以确保运营的可靠性。
根据每一代服务器和相关设备的发展,一个新的趋势就是根据摩尔定律对这些器件的速度和处理能力的要求不断上升。由此产生的连带影响就是集成电路的散热要求也越来越高。
本文结合理论和案例讨论了数据中心热设计的问题。
Introduction
Microprocessors and integrated circuit (IC) components are found in the majority of the electronics equipment inside datacentres. It is important that we do not exceed the maximum allowable junction temperatures for these components, as it could result in reduced reliability and equipment failure. Consequently, equipment manufacturers usually specify a range of intake temperatures for their equipment in order to ensure reliable operations.
With every new generation of servers and other equipment, there is a trend towards ever-increasing speeds and processing power as described by Moore’s Law. The by-product of that is increasing heat dissipation by these ICs.
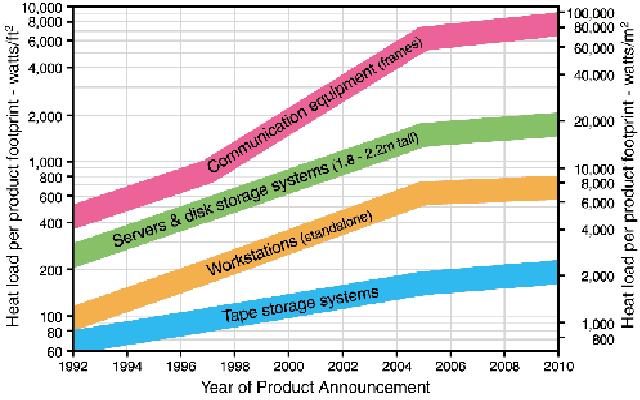
Thus it has become increasingly important to get the airflow and thermal design right due to the exponential increase in the heat loads per rack. For example, in 1996, the typical heat loads per rack was less than 1 kW. However, by 2001, this has increased to over 12kW, and the trend is still showing an increase. Figure 1 shows the predicted trends for the power dissipations by the various rack equipment.
What is CFD ?
CFD stands for Computational Fluid Dynamics. This is a numerical method using the Navier-Stokes equations to determine the pressure, temperature and velocities at any point in a given space.
Why use CFD ?
There are numerous advantages in using CFD methods for airflow design.
For example, we can accurately determine the airflow patterns and temperatures anywhere in the model. This allows us to identify any potential problems and hot spots prior to the construction of the datacentre. It also allows us to determine whether the ventilation design is adequate for future expansions.
Even the internal layout of the cabinets can be optimized when considering the different types of servers and other equipment to be used within the cabinets.
Failure analyses of the CRACs can also be carried out as well as the consequences of a power failure, resulting in all the CRACs being turned off.
Some CFD examples
-Supplemental cooling products
In this example, a cabinet containing 32 servers was simulated (Figure 2). Three different scenarios were examined. In the first, the cabinet did not have any supplemental cooling products. This acted as the reference. In the second scenario, a fan tray was used, while in the third, an Air Distribution Unit (ADU) was placed at the top of the cabinet.
The simulation results are shown in Figure 3. Here we find that the reference case will give us the highest temperatures within the cabinet. There are a couple of hot spots, one at the top of the cabinet, and the other is directly behind the 14 Compaq servers located in the centre of the cabinet. Using a fan tray, the hot spot from the top of the cabinet is eliminated, but the one behind the servers is still present. The ADU gives the best solution as it is able to eliminate both hot spots giving the lowest temperatures within the cabinet.
Cabinet placement within the datacentre
Figure 4 shows a simple example where only one rack is present in a raised floor datacentre. The location of this rack with respect to the CRAC and floor grille has an impact on the temperatures developed within the rack. As in the previous example, the airflow patterns are the contributors to the cooling performance, as the cold air from the floor grilles will have a different path into the cabinet due to the different rack locations.
Room layout
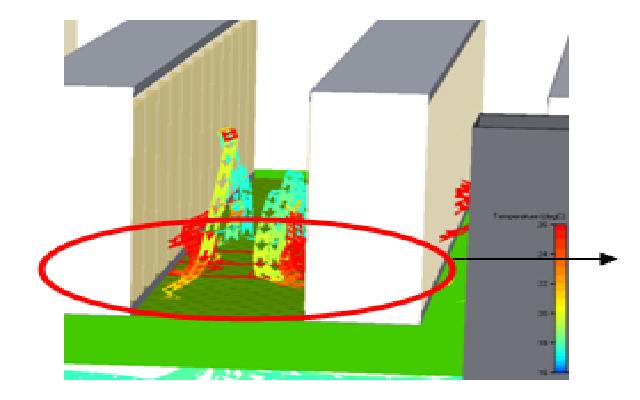
A simple example is shown in Figures 5a to c. There are four rows of racks, three cold aisles, and two CRACs. The datacentre has a 600mm deep floor void, with under floor cables. Figures 5a and 5b show the streamplots superimposed on the pressure and temperature contour plots, respectively. Strong jets of cold air exit from the CRACs at high velocity. These travel to the far end of the datacenter and will turn back on themselves due to the presence of the wall. Interaction between the deflected airflow and the jets of air result in the two distinct recirculation zones, which are also regions of low pressure. In this example the low pressure zones draw warm air from above the raised floor down into the void, as seen in Figure 5c. Thus the air supply temperatures to the racks are compromised due to the less than ideal short-circuiting of hot air back down into the floor void.
Conclusions
Rules of thumb and design experience may be useful in giving us ball-park figures for cooling requirements, but these are insufficient if we want to optimize the ventilation design in order to cut down on running costs.
As seen from the few examples given above, the airflow developed within a datacentre, below the raised floor, or within a cabinet, is extremely complex, and cannot be predicted accurately without using numerical methods such as CFD. It is vital for us to be able to accurately predict what is happening within any datacentre, in order to be able to ensure that there are no hot-spots or any problems with the airflow.
 |
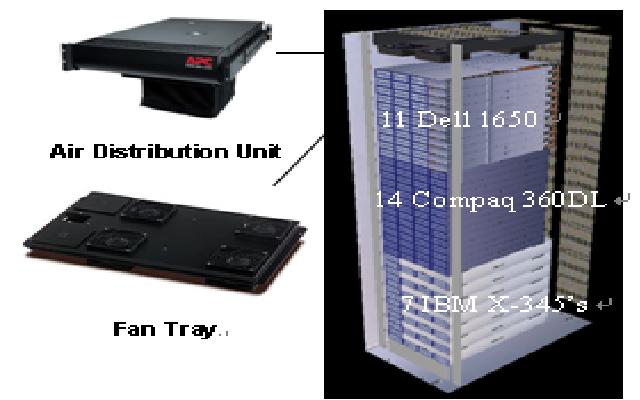 |
| Figure 1 Increasing trend for power densities (© www.uptimeinstitute.org) | Figure 2 Internal layout of the cabinet and photographs of the different supplemental cooling products used |
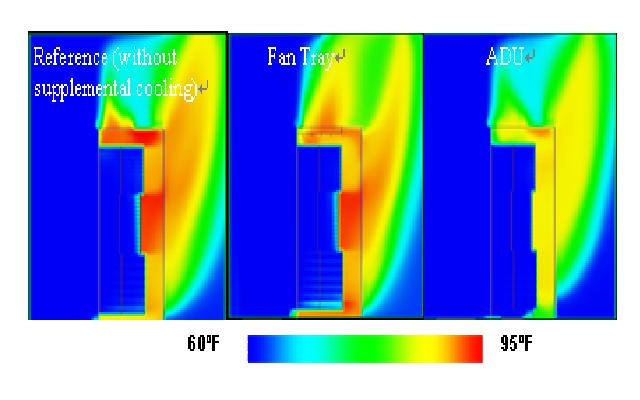
Figure 3 Temperature profiles within cabinet and the resulting flow patterns
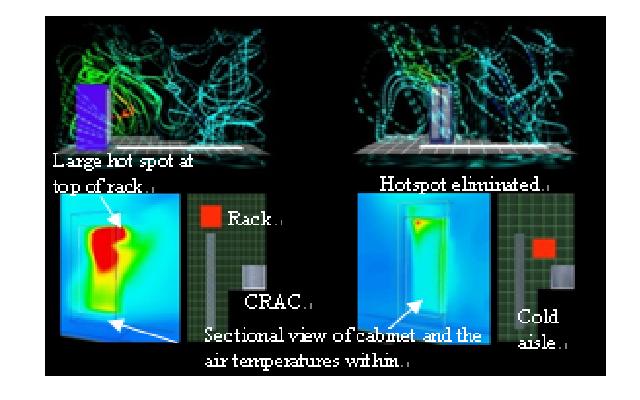
Figure 4 Rack placement and its effect on rack temperatures
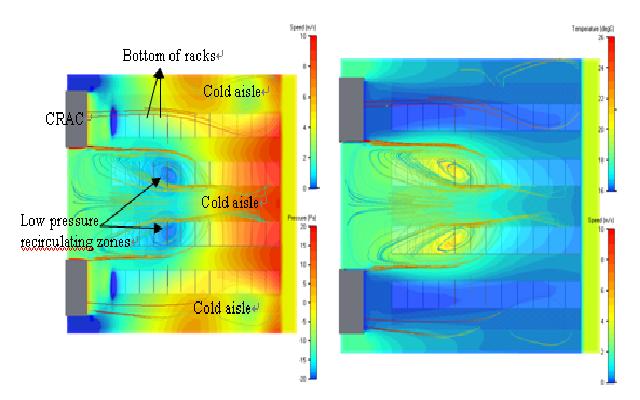
| Figure 5a Under floor view of pressure and airflow patterns | Figure 5b Under floor view of temperature and airflow patterns |
 |
|
| Figure 5c The short-circuiting of hot air due to the low pressure regions identified in Figure 5a | |

 沪公网安备 31010602003953号