评估PCB和器件的热传导在自然对流换热中对器件温度的影响
日期:2012-06-20
Estimating the Influence of PCB and Component Thermal Conductivity on Component Temperatures in Natural Convection |
|
Tony Kordyban Tellabs 4951 Indiana Avenue Lisle IL 60148 USA The Question What is a good value of thermal conductivity to use in FLOTHERM simulations for printed circuit boards (PCBs) and components if you have no real data? The Short Answer10 watt/m/C. The Long Answer: Case studies of a Simulation Method
A method of predicting component temperatures.
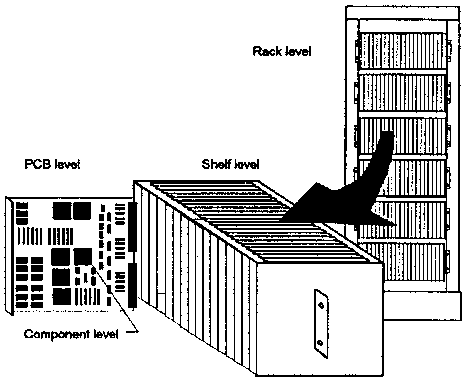
Usually the temperature of only a few critical components is of interest. By trial and error I have developed a method for modeling PCBs in natural convection. The first step is to divide the components into two sets: Important and Trivial. Important components are those for which I want to know the temperature. Either they are high power, or temperature sensitive. Trivial components are all the rest. They are low power and are not worth modeling in detail, because I already know they will not be hot. But the power they add to the board, and the flow resistance they cause will not be ignored. Almost everything is a Solve-in-Solid Cuboid Block. The PCB, the important components and the trivial components are all Solve-in-Solid Cuboid Blocks. Internal Plates and FOB elements are only rarely used, because in natural convection problems, temperature is not very uniform, and conduction in all three directions can be very important. Internal Plates do not conduct heat along their surfaces, and POB elements do not conduct heat perpendicular to their surfaces. Models of Trivial components must have the following characteristics: they block air flow; they contribute heat by conduction into the board; they act as heat dissipating surfaces to the air, possibly conducting heat between the board and the air; and they contribute heat to the air stream, causing some portion of the air flow. All these things they should do in a reasonable approximation of the individual components. By reasonable I mean not totally accurately, because I am not concerned with predicting the temperatures of these parts. I am concerned that the effect of Trivial components on the temperature of the Important components is well modeled. The easiest way to do this is to identify patches of the POE populated with Trivial components that are all about the same height, to draw a cube around them, to add up all the individual power dissipations, and to assign that power to the Solve-in-Solid Cuboid Block. The accuracy 'with which the Block must represent the individual components is more important near the Important components, and not very important far away. Each Important component is also modeled as a Solve-in-Solid Cuboid Block. I draw a cube that just encloses the component, and is flush to the PCB, unless the real component is mounted high off the PCB. The normal tiny gap under DIPs and surface mount parts is usually neglected. I do not try to model details such as leads, lead frames or the die inside the package, because the properties and geometry are generally not known, and would require too much detail (and a very fine grid) if a whole PCB were modeled this way. The power dissipation is assigned to the whole block uniformly. The PCB is a Solve-in-Solid Cuboid Block with no power dissipation. Unlike an Internal Plate, it allows heat conduction from one component to its neighbors. Unlike the simple FLOTHERM PCB element, the Solve-in-Solid Cuboid Block POE conducts heat from one side of the board to the other. My experience is that the simplified representation of boards by Internal Plates and PCB elements is just not adequate for natural convection. It tends to overpredict component and air temperatures. There is one characteristic of the Solve-in-Solid Cuboid Blocks that I have not talked about yet which is very important in getting this modeling technique to work. That is choosing the thermal conductivity, which is the original question above. Each component and the PCB itself is a three-dimensional composite of different materials with vastly different thermal conductivity. The conductivity of copper is three orders of magnitude greater than that of epoxy resin or the plastic package compound. It is not a simple thing to look at a 28 pin DIP and come up with a single lumped together value of thermal conductivity. It is also not obvious how to calculate the lumped conductivity of a PCB that may not even have been designed yet. If one has a finished PCB design, it is at least possible to estimate the ratio of copper to epoxy.
Analytical approach to conductivity.
 where kn is the conductivity of the nth layer and tn is the thickness of the nth layer. For a double-sided PCB with solid layers of 1 ounce copper on the top and bottom with a total board thickness of 1.59mm we can estimate a board conductivity of:
 The conductivity of the PCB perpendicular to the plane of the board in this example is not affected much by the presence of the copper layers, and is still only about 0.26 W/m/C. A real board has numerous vias that conduct perpendicular to the board, and if the via density is known, an effective conductivity in the perpendicular direction can be calculated. A real board does not have totally solid signal and ground layers, and the effect of signal layers may have at least some local effect on board conductivity. The simple calculation above gives us a starting point, at least in order of magnitude, for searching for values of kPCB and kcomponent that allow this modeling method to predict component temperatures accurately. CASE STUDIES
HDSL.
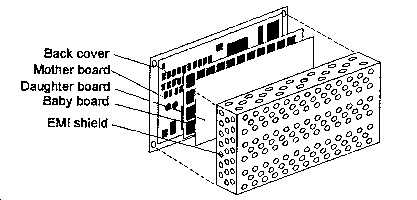
solve-in-solid Cuboid Blocks could model components accurately. We were particularly interested in two components, code-named Processor and Timber. Processor and Timber were modeled individually, and all the other components were lumped together in large cuboid blocks. Thermal conductivity for all the components and the PCBs was set at 10 W/m/C. After running the FLOTHERM simulation, refining the grid, and getting the best possible temperature results, I showed the model to the team rather cautiously, because it predicted that Processor would be too hot. Not willing to accept bad news, the team sharpened its collective pencil, recalculated the power estimates, and cut them nearly in half. That knocked more than 20C off Processor's temperature, which made us happy, and several months later, when a prototype was tested, I was pleasantly shocked at the results in Table 1.

These results appear almost too good to be true, and because only two components were modeled in detail, it was impossible to tell if the match of prediction with measurement was only a lucky coincidence. This early result did teach me that it would not be possible to determine a useful value of thermal conductivity for PCBs and components unless component power dissipation is known accurately. In the HDSL model, the thermal conductivity was chosen because it was in the realistic range between 1 and 100 W/m/C hinted at by the analytical approach. After the experimental results came so close to the predicted values, 10 became a number to keep in mind. Power supply board Figure 3 shows an extreme application of the method of combining components together into large Solve-in-Solid Cuboid Blocks. This board is a DC-to-DC power converter that supplies the rest of the PCBs in the shelf from -48V input. In the FLOTHERM model I lumped together all the components, except for one relay, into a single Solve-in-Solid Cuboid Block that covers almost the entire board. The relay is modeled as another Solve-in-Solid Cuboid Block. This model, of course, is not very useful in predicting component temperatures on the power supply board, but in this case, that was not my purpose. The power supply had already been built, and I already knew all the component temperatures by measurement. What I did not have were multiple copies of the power supply, and the problem that I needed to simulate was how many shelves could be stacked vertically and still be cooled safely by natural convection. The lame Solve-in-Solid Cuboid Block would add the heat to the air stream, causing air temperature to rise from one shelf to the next. The relay block represented a "typical" component on the board, to give me some idea how component temperatures would rise from shelf to shelf: I chose the relay because it was one of the hottest parts on the board, and its power dissipation was fairly well known. Although the total dissipation of the rest of the board was known accurately by measuring the input and output currents, the dissipation of the individual analog components was almost impossible to determine.
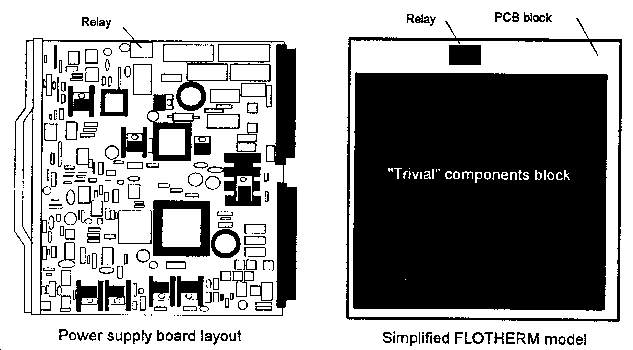
Again the value of 10 W/m/C was used for the PCB as well as the two Cuboid Blocks. For the single shelf case (which was the only case that could be verified experimentally), the temperature results were:

This is not a landslide of data. It was not intended to be at the time. However, this one data point gave me the feeling that there were at least a few things right in the model: the power dissipation, the physical geometry, and the thermal conductivity of the solids. This gave confidence that growing the model by stacking additional shelves would have a good chance of being accurate, or at least a much better chance than a model of a system of shelves that had no grounding at all in experimental data. At this point I might even accuse myself of picking and choosing my case studies to show only the most favorable results. It is true that I have been picking and choosing. My FLOTHERM casebook is full of temperature predictions, and my lab notebook is full of temperature measurements, and it is very difficult to find numbers that match. The general trend is that the predictions are somewhat higher than the measurements. I believe that the most important reason for this is the overestimation of power dissipation for components in the models. The criterion I used for selecting the cases from my records was whether component power dissipation was well defined. The simple "Icc (max)" from the manufacturers' data sheets was not good enough.
Typhoon.
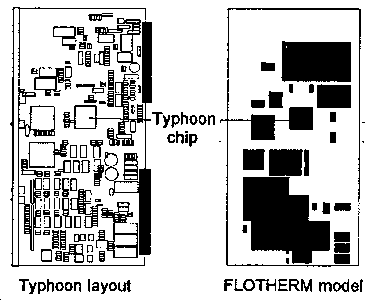
All the conductivities were originally assigned as 10 W/m/C, and the grid was refined until the component temperature change was less than 10. Then various combinations of PCB and component thermal conductivity were tried to see which would make the best match between component temperature predictions and the temperature measurements. Only the Important components were considered in the correlation, because it was assumed that the temperature of the large, lumped-together blocks would not accurately represent any one component in them. The comparisons are shown in Table 3.
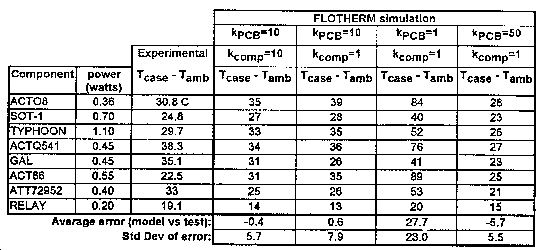
temperature predictions with measurements. This PCB had lots of copper: four signal layers, a power plane and a ground plane. It makes sense that the PCB conductivity should be closer to 10 W/m/C than to 1 or to 50, as borne out by Table 3. Table 3 also seems to indicate that the conductivity of the individual components is not as important as the PCB conductivity, as long as it is in the range between 1 and 10 W/m/C. That is probably because power is dissipated uniformly within the volume of the Cuboid Blocks, leading to little or no temperature gradient inside the blocks. This study seemed more realistic than the first two examples given above, because no single component matched prediction and measurement exactly under any condition. Also, adjusting the single parameter of conductivity had the expected effect on the average error for all the important components, rather than just for one or two components.
Resistor Board. In the experiment, a total of five watts was applied to the resistor board. Five watts for a board of this size is typical for products cooled by natural convection. Case temperature of each resistor was measured by thermocouple. The power of each resistor was confirmed by measuring the voltage drop across each after they had reached steady state temperature under power. Two types of FLOTHERM models were built. The first attempted to simulate physical reality as closely as possible. The board was a Solve-in-Solid Cuboid Block with k = 0.2 W/m/C. Each of the 21 resistors was a Solve-in-Solid Cuboid Block with k = 10 W/m/C with a uniform power dissipation of 0.238 watts. The wire connecting them in series was also modeled as a Solve-in-Solid Cuboid Block with k = 200 VV/m/C. The only large departure from reality was approximating the cylindrical shapes of the resistor bodies and the wires as cuboids. The dimensions of the cuboids were adjusted to give the same surface area as the original cylinders.
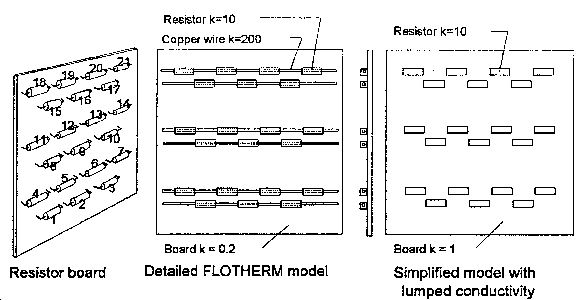
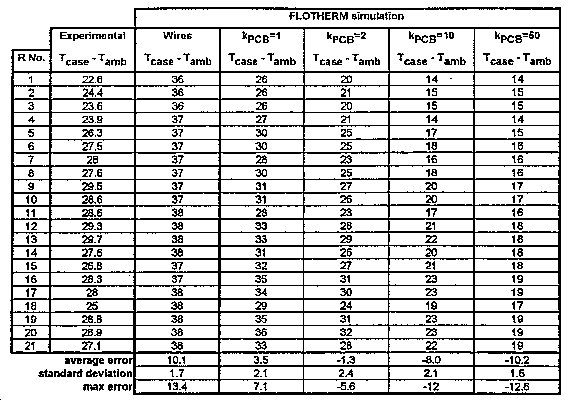
be measured, and the copper and epoxy can be modeled separately. The second type of FLOTHERM model was a simplification of the board and wires, lumping them together and assigning a composite thermal conductivity to the board. This is the method used in the first three cases above, where modeling the details of the printed wiring was impractical. In this case it was expected that the simplified model would have more error that the more detailed, more realistic model. The thermal conductivity of the real board was very non-uniform: the wire connecting the resistors snakes across the board in a way that should create small areas of high conductivity and large patches of very low conductivity. The results in Table 4 show some surprises. The column marked "Wires" is the detailed model that modeled the wires and the board separately. It tended to overpredict the resistor temperatures by about 10C. The surprise here is that the simplified model with the composite value of thermal conductivity actually does a better job of matching the experimental results. The best value of k for the board is about 1 or 2 W/m/C. It is expected that a value lower than the magic 10 W/m/C should work better in this case, because the amount of copper involved is quite a bit less, and it is not uniformly distributed around and through the board. Board conductivity higher than 2 W/m/C leads FLOTHERM to predict lower and lower resistor temperatures. The negative sign for the average error in these simulations indicates that the prediction is lower than the measurement. Setting the value of board conductivity "too high" in this simulation causes too much heat to spread into the board from the resistors, leading to unrealistically low component temperatures. This type of error is probably more dangerous than overpredicting component temperatures.
Warnings and Limitations The conclusions of this paper are more in the nature of reporting my experience with PCB thermal conductivity, rather than a rigorous scientific experiment. I have carefully chosen the cases that were reported, 'with the best of intentions, but the very fact that I chose to report some cases and not others means that my personal bias cannot be excluded. Assuming that the work I have done is valid, there are still some limitations to its application:
I have presented a method for modeling arrays of Printed Circuit Boards in natural convection that predicts the case temperatures of the Important components; That method has a few simple steps:
Experimental evidence (perhaps it should be called "experiential" evidence) has been presented to show some success with this method in predicting component temperature, and that the value of 10 W/m/C for PCB conductivity is a good place to start. Conductivity of components is probably not critical for accuracy, as long as it is in the neighborhood of 1 W/m/C.
My hope and my recommendation are that other FLOTHERM users try this method, and report whether it works or not. I think that it can be a handy short-cut for solving certain kinds of FLOTHERM problems, and will prove to be of some value if it is validated by the experience of other FLOTHERM users. |


 沪公网安备 31010602003953号